Back to projects

High-Speed Hockey Tracker

A walk-through of the pipeline I built for tracking players, jerseys, gaze, and on-ice position — and rolling it all up into a single performance score.

Step 01 · Data Collection & Annotation

Building the dataset

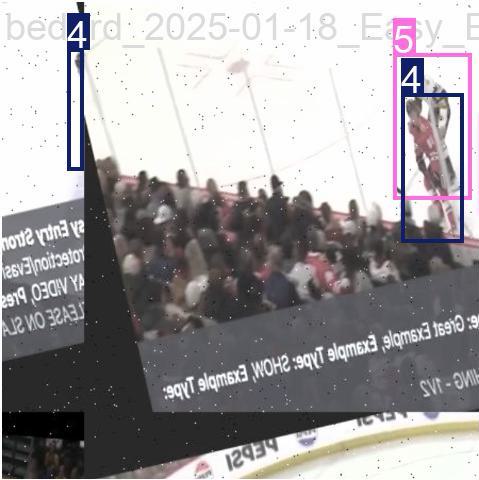
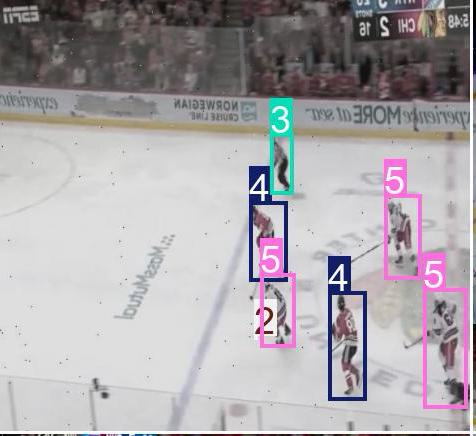
Every model in this pipeline depends on a strong dataset. I manually annotated 10,000 hockey frames — players, pucks, referees, jersey numbers, and key ice features — then ran an augmentation pipeline (rotations, color shifts, brightness, mirroring, motion blur, occlusion) to expand the working set to roughly 60,000 training images.

This augmented set gave the downstream YOLO models enough variation to generalize across broadcast camera angles, lighting conditions, and motion-blurred high-speed plays.
Annotated hockey frame sample
Sample annotated frame with segmentation polygons
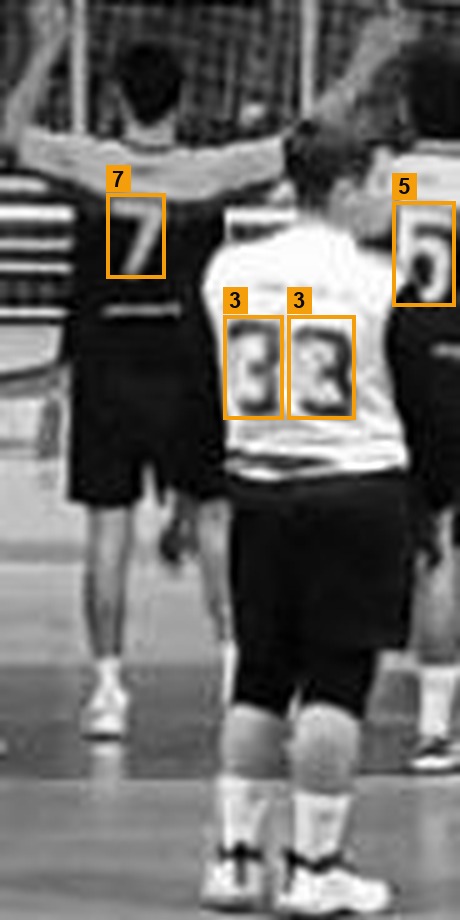
Annotated jersey number detections on a player crop

Step 02 · Object Detection & Tracking

Training the YOLO models

Using the prepared dataset I trained YOLOv8 and YOLOv11 models to locate and track the important characters on the ice in real time — players, puck, and referees. A second, specialized jersey number detection model was trained on cropped jersey regions so each detected player could be identified by their number rather than only relying on positional tracking.

The three clips below show the tracker running on different game scenarios.

Step 03 · Gaze Detection

Where are the players looking?

On top of the tracking pipeline I integrated a pre-trained gaze detection model to estimate where each player on the ice was looking. Gaze direction is a strong signal for awareness, decision-making, and play anticipation — knowing where a player is looking before they make a pass or shot is far more informative than just their position.

The clip below shows the gaze vectors overlaid on tracked players in a live sequence.

Step 04 · Ice Homography

Mapping the rink to a 2D plane

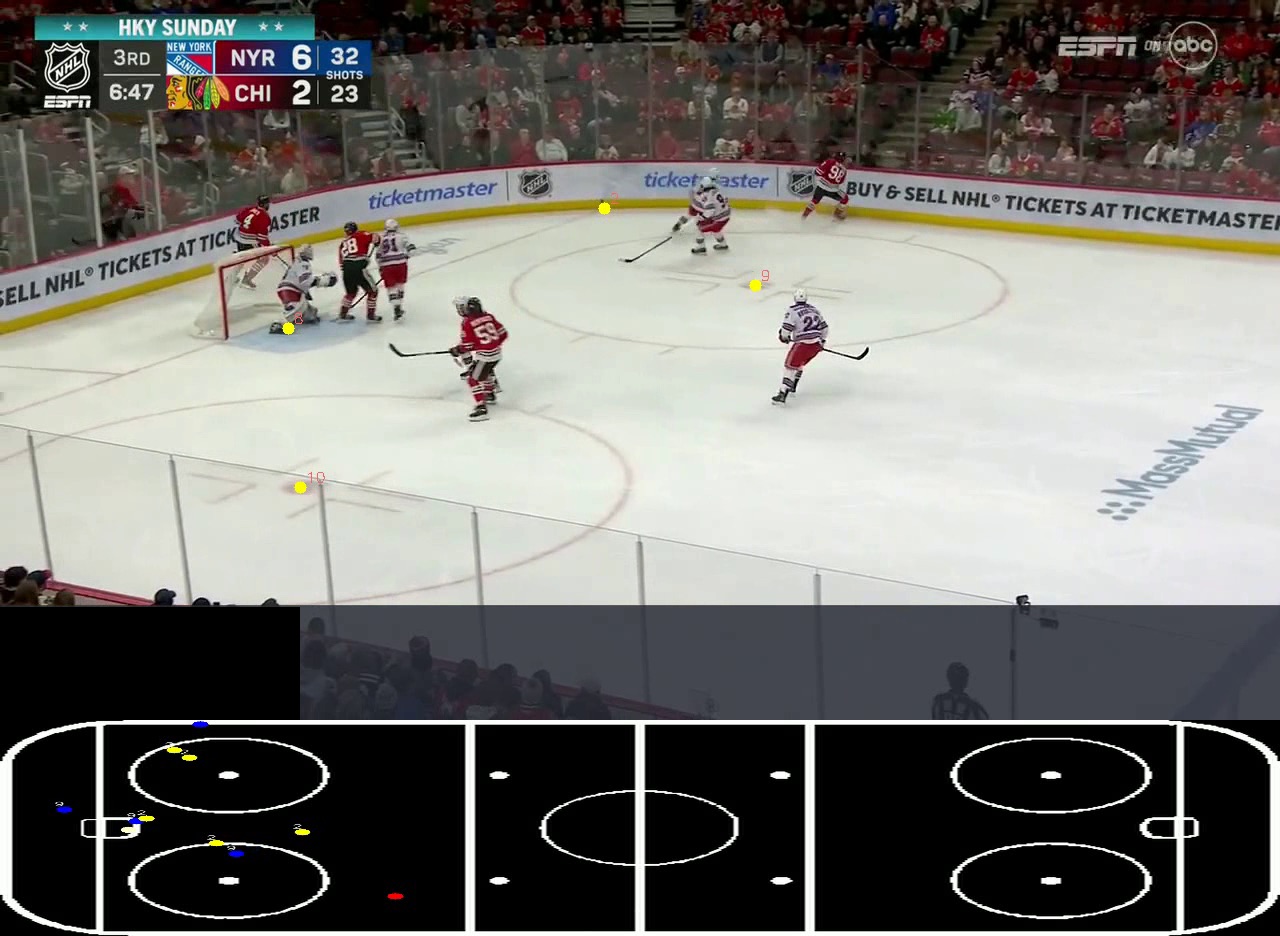
To reason about positioning, I trained another model to detect key ice features — face-off dots, blue lines, goal lines, the center circle, and rink corners. Those reference points were fed into a homography transform that warps the broadcast camera perspective into a top-down 2D rink view.

Each tracked player's foot position is then projected through that same homography, so every detection from Step 2 has a real position on the rink — not just pixel coordinates. This is what makes downstream analysis (distance to net, spacing, lane control) possible.

Step 05 · Performance Scoring

From tracking data to a single score

With player positions, jersey IDs, gaze direction, and rink-space coordinates all flowing out of the previous steps, the final stage rolls everything together into a per-player effectiveness score from 0 to 100. The score weighs a number of hockey-specific factors:

Shot quality

Whether a shot on goal was taken into a crowded net, the shooting lane, and distance to the goalie.

Defensive configuration

Spacing and coverage of defensive players relative to opposing forwards and the puck carrier.

Puck control

How long the player retained possession, completed passes, and avoided turnovers in pressured zones.

Awareness & gaze

Whether the player's gaze was directed toward the play, open teammates, or developing threats prior to acting.

Positioning

Rink-space placement relative to teammates, opponents, and the puck across each sequence.

Play impact

Contribution to goals, scoring chances, breakouts, and zone exits — credited to all involved skaters, not just the shooter.

Step 1 of 5